

Ethereum Announces Q2 2022 Results
Ethereum Announces Q2 2022 Results

GLOBAL, Jul. 8, 2022 — Ethereum (DEX: $ETH) today announced financial results for the second quarter ended June 30, 2022.
Second Quarter 2022 Financial Results:
Revenue: network fees in Q2 were $1,220 million, down 35% year over year from $1,864 million in Q2 2021.
Earnings: total value of ETH burned (removed from the supply) in Q2 was $1,033 million, up from $0 in Q2 2021. Ethereum began burning ETH with the implementation of EIP-1559 on August 5, 2021.
Gross Margin: burn rate in Q2 was 85%. Burn rate is the percentage of network fees that were burned.
Share Count: ETH supply at the end of Q2 totaled 118.86 million, up 2% year over year from 116.51 million in Q2 2021.
Transaction Volume: value settled on Ethereum in Q2 was $407 billion, down -49% year over year from $794 billion in Q2 2021.
Transaction Fees:
The median transaction fee, known as “gas,” in Q2 was $4.32, down 37% year over year from $6.81 in Q2 2021.
The mean transaction fee in Q2 was $12.06, down 17% year over year from $14.51 in Q2 2021.
User Metrics:
Daily active addresses in Q2 were 0.47 million, down -21% year over year from 0.59 million in Q2 2021.
Monthly active addresses in Q2 were 6.43 million, down -31% year over year from 9.26 million in Q2 2021.
Total addresses with balance > 0 ended Q2 at 83.16 million, up 39% year over year from 59.89 million in Q2 2021.
Staked Ethereum: ETH staked at the end of Q2 was 12.98 million, up 116% year over year from 6.01 million at the end of Q2 2021. The 12.98 million staked ETH represents total economic value of $13.8 billion. Staked ETH equals 10.9% of the total ETH supply at the end of Q2, up from 5.2% in Q2 2021.
Hash Rate: computing power securing Ethereum via Proof-of-Work at the end of Q2 was 875,044 GH/s, up 85% year over year from 474,161 GH/s at the end of Q2 2021. Blockchain security increases with increased hash rate.
Ecosystem Results:
DeFi Total Value Locked (TVL): the total value of ETH locked in decentralized finance protocols at the end of Q2 was $74.31 billion, down -27% year over year from $101.38 billion in Q2 2021. ETH locked in DeFi equals 59% of the total ETH supply at the end of Q2, up from 38% in Q2 2021.
DEX Volume: total volume across all decentralized exchanges in Q2 was $361 billion, down -10% year over year from $402 billion in Q2 2021.
NFT Volume: total volume on leading NFT marketplace OpenSea in Q2 was $9.13 billion, up 2,272% year over year from $385 million in Q2 2021.
Stablecoin Value: total cumulative stablecoin issuance on Ethereum at the end of Q2 was $145 billion, up 34% year over year from $109 billion in Q2 2021.
Bitcoin Value: wrapped BTC on Ethereum at the end of Q2 was 309,360, up 24% year over year from 248,670 in Q2 2021. This represents 1.6% of the total bitcoin supply.
Second Quarter 2022 Highlights and Market Commentary
Q2 ‘22 will certainly be remembered as an unforgiving bear that took down wide swaths of the crypto ecosystem with it. But will it also be remembered as the bear that killed CeFi while DeFi emerged stronger?
The market cleanse began in earnest in May when algostable UST broke it’s peg and took down sister token LUNA and the entire TerraLuna ecosystem with it. We didn’t know it yet, but this was the first shoe to drop in a series of blow-ups that finally(?) culminated with mega crypto hedge fund Three Arrows Capital’s (3AC) insolvency taking down a number of CeFi crypto lenders with it including Celsius, BlockFi and Voyager.
The major price puke (final purge?) in ETH occurred on June 18 when news of the 3AC insolvency broke, with the weekly candle wicking down to $880 on heavy volume which you can see on the chart below. The only other two times in history with weekly volume this high on negative price action represented major bottoms in March 2020 and May 2021.
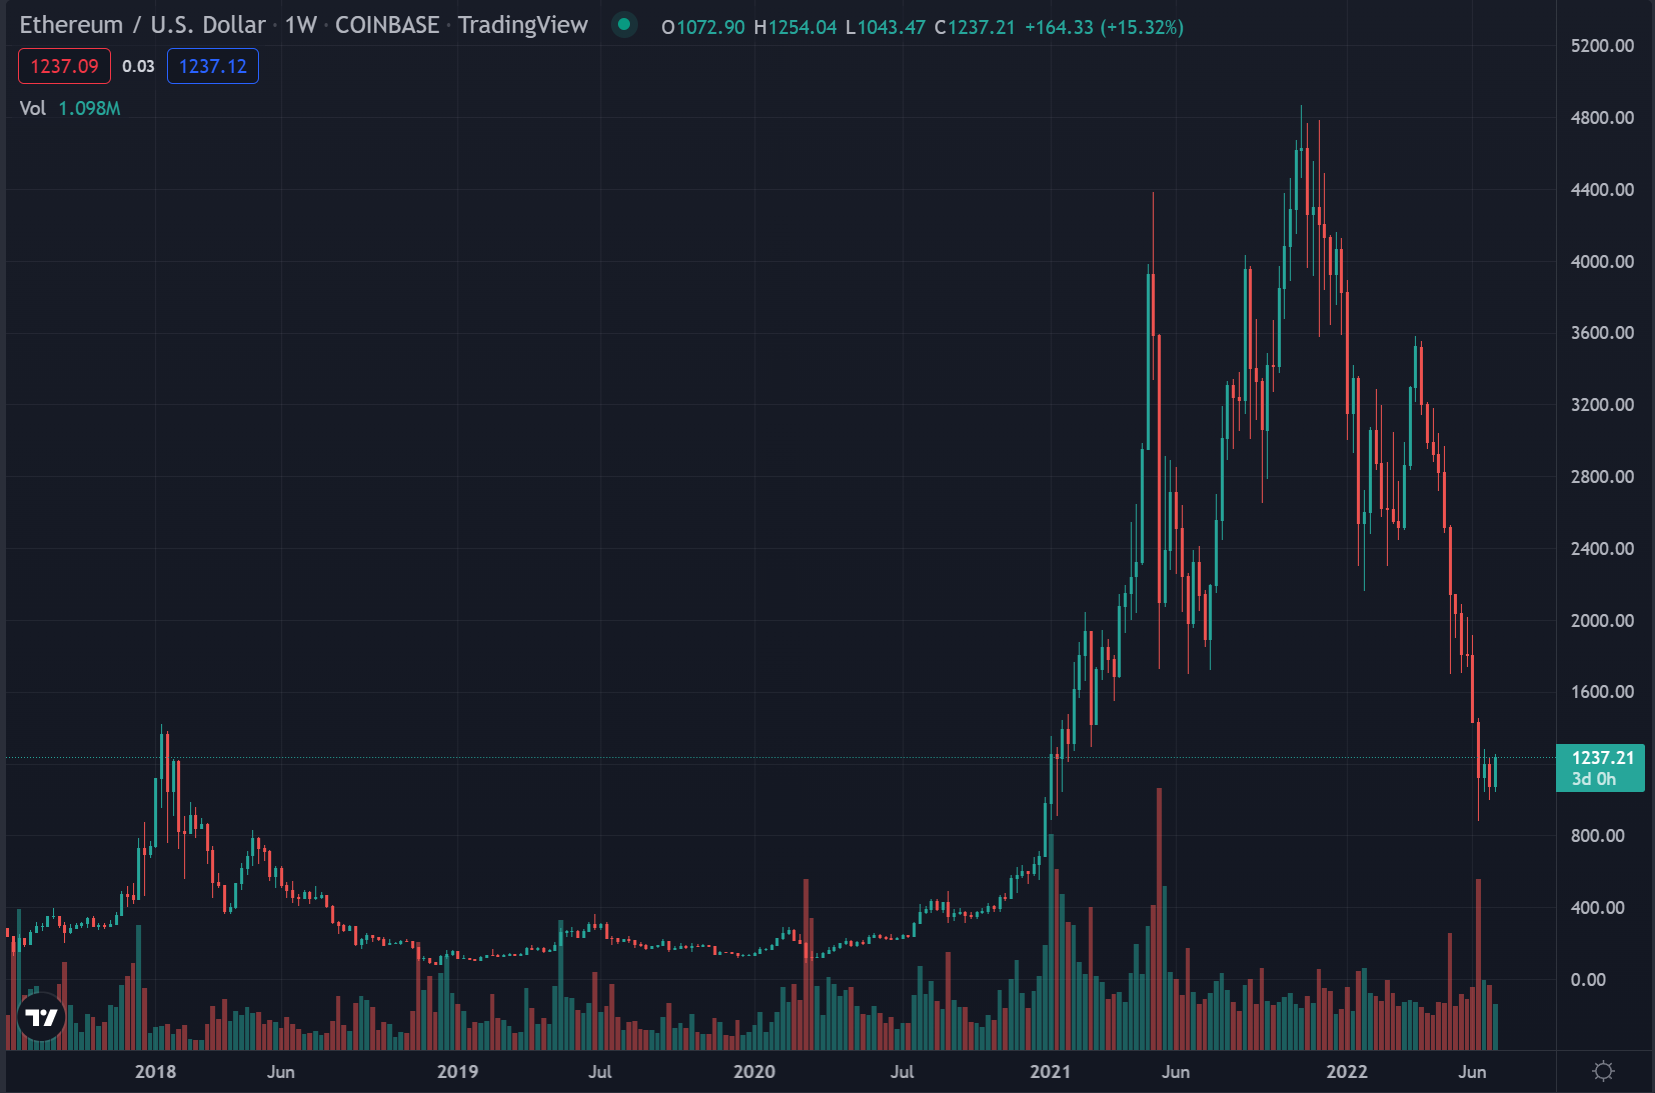
This is a pattern throughout history and across asset classes: bottoms form on huge volume driven by forced sellers.
The Yield Was The Friends We Made Along The Way
Or was it?
Notice the list of casualties above includes a number of CeFi institutions, but only one actual DeFi protocol in Terra Luna.
Terra Luna was a unique case where an algostable grew to massive market cap on unsustainable 20% “yields” financed through the continued growth in demand for the asset, which in turn was driven by the 20% “yield.”
It was perhaps the #1 most debated battleground token, with many thinking the holy grail of a true decentralized stablecoin had been born out of the proper incentives and governance model while many others derided it as a ponzi and doomed to fail in a classic death spiral as other algostables had before it.
The nays have it.
However, DeFi lending protocols built on Ethereum such as MakerDAO, Compound and Aave have continued to function brilliantly through the market volatility, while market contagion has been limited to CeFi crypto lenders Celsius, BlockFi, and Voyager among others.
Through it all, DeFi’s value propositions of overcollateralized lending and on-chain transparency have shown through.
While many are calling the whole episode a black-eye for crypto (and Do Kwon’s handling of the Terra collapse is certainly a black-eye for proof-of-stake governance models, but that’s for another day) the truth is that DeFi has shown it’s resiliency and indeed its reason for existence in the first place (transparent, on-chain, permissionless lending/borrowing), while CeFi institutions have repeated the mistakes we see time and again, the most recent analog being in 2021 when several banks had overlent to Archegos without realizing they all had overlent to Archegos.
3AC is simply a crypto redux of Archegos one year later; the difference is Celsius, BlockFi and Voyager were not as well capitalized as Goldman, Morgan Stanley and CS and were not able to survive the counterparty default.
It takes some courage and/or stupidity to remain bullish through a market rout, but if you take a long-term view of the events of the last couple months, I have to imagine that DeFi protocols such as MakerDAO, Compound and Aave are positioned well to take share from their CeFi competitors who were wiped out and emerge stronger in the next cycle.
The Chart of Truth
Finally, I want to revisit the key chart for the crypto thesis in my mind — adoption, as illustrated by growth in addresses with balance > 0.
Ethereum ended Q2 at an all-time high of 83 million addresses with balance > 0, up 7% QoQ and 39% YoY.
Through the noise, every day tens of thousands of people are buying their first ETH.
The smooth and uninterrupted exponential curve of adoption continues.
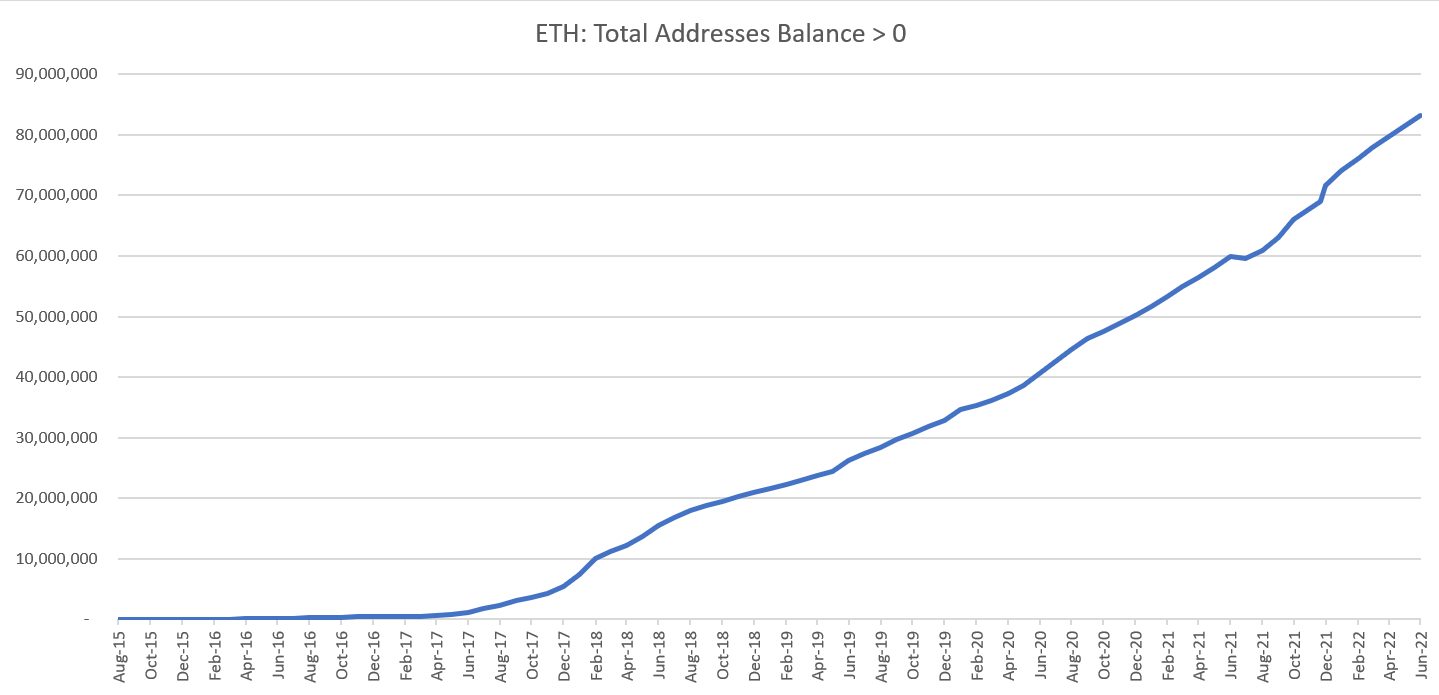
source: Glassnode, No Conflict No Interest
If we look at the Metcalfe’s Law network valuation model (Metcalfe’s Law = value of a network if proportional to the square of the number of nodes on the network), we can see that at current prices ETH’s market cap has never been more undervalued against this model in absolute terms, with the model suggesting a market cap of $700 million versus an actual market cap of just over $100 million.
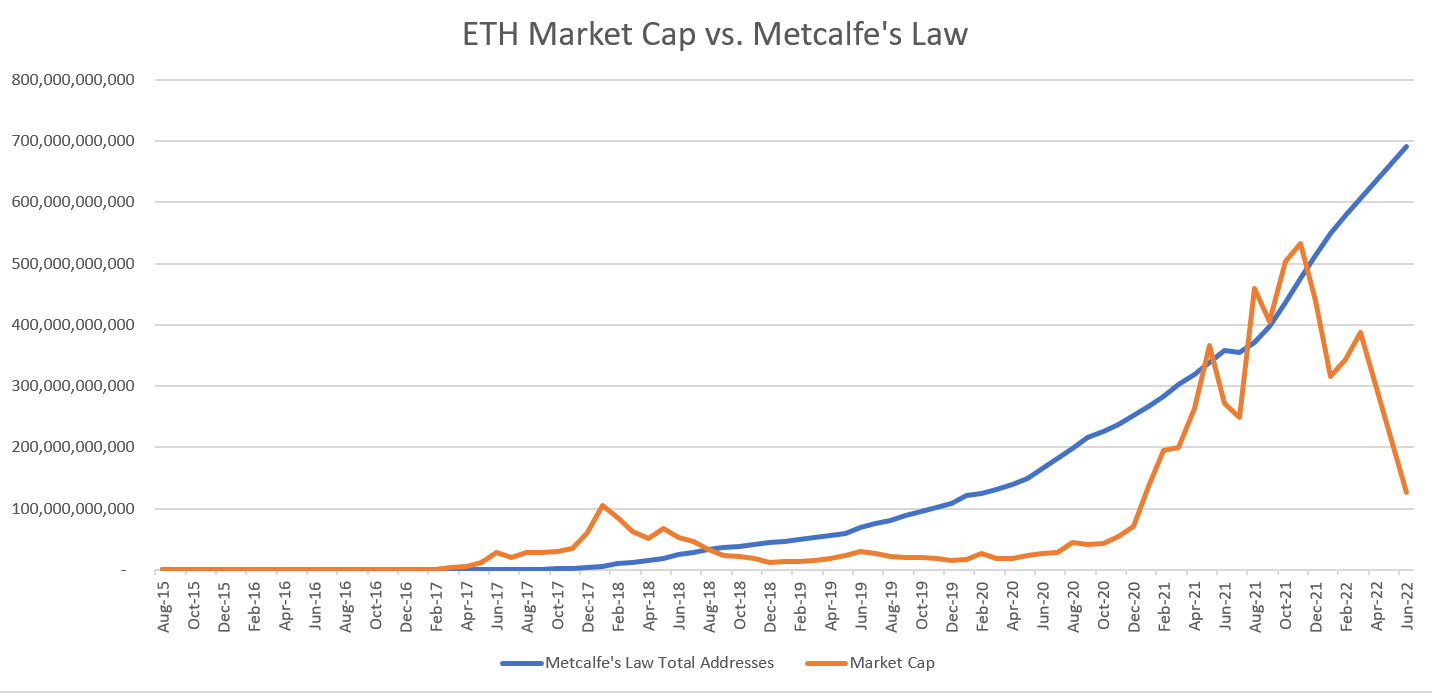
source: Glassnode, No Conflict No Interest
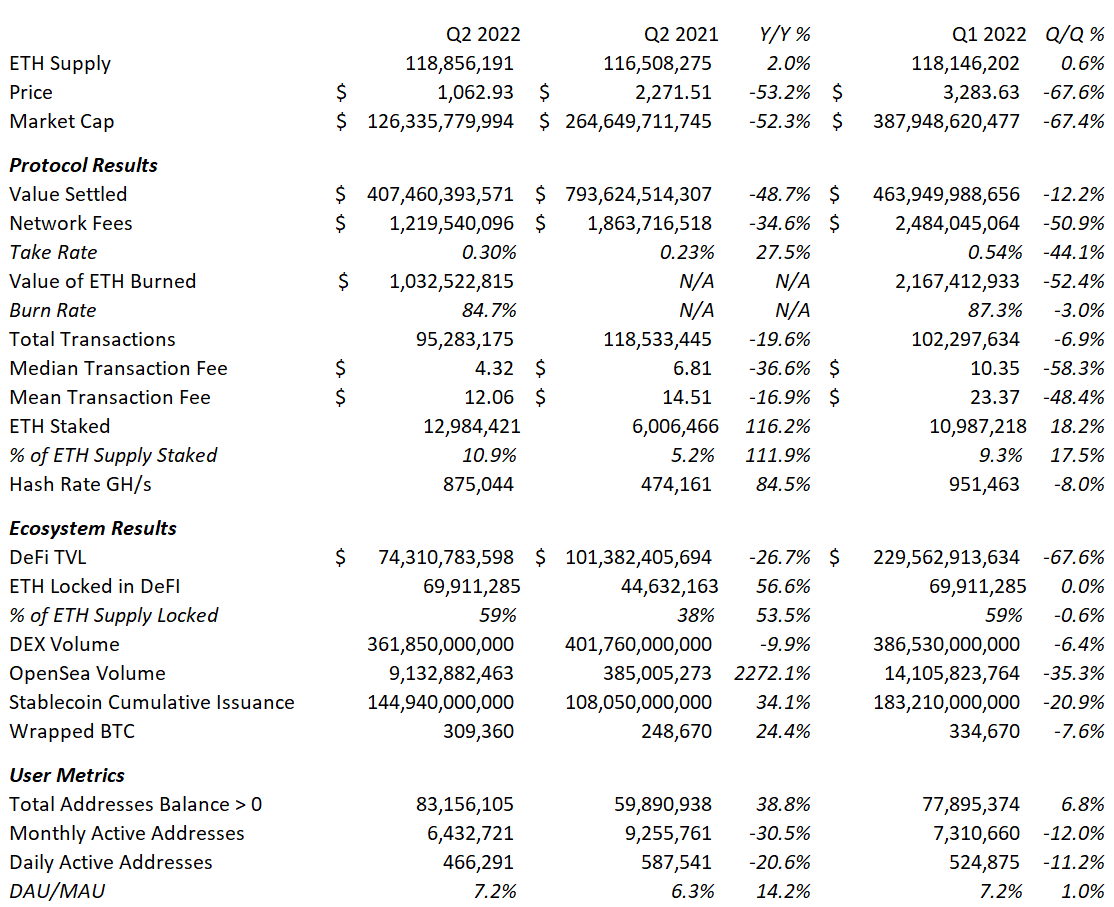
Results Table
Disclosure: I own ETH, MKR
About Ethereum
From ethereum.org: Ethereum is the community-run technology powering the cryptocurrency ether (ETH) and thousands of decentralized applications. Ethereum is a technology that's home to digital money, global payments, and applications. The community has built a booming digital economy, bold new ways for creators to earn online, and so much more. It's open to everyone, wherever you are in the world – all you need is the internet.
About this Release
This release is not an official release of Ethereum or the Ethereum Foundation. The purpose of this release is to provide data and a framework for analysts and investors to think about valuing Ethereum as they would a publicly traded company, using traditional metrics, multiples and methods. The data contained in this release was sourced from Glassnode Studio, Dune Analytics and The Block.
For inquiries please contact the author on Twitter @realzackm.
Disclaimer: nothing published in this newsletter is financial advice. The author may be long or short any of the securities or assets discussed at any time before or after publishing.