

Bitcoin: Looking At On-Chain Technicals To Gauge Investor Sentiment
Bitcoin: Looking At On-Chain Technicals To Gauge Investor Sentiment

This is a crosspost with this week’s Weekly Roundup from Onramp, with some of my own, additional color. Views are my own.
Bitcoin's transparent, real-time ledger provides market sentiment insights that are unattainable with traditional assets.
On-chain metrics reveal investor psychology & assist in deciphering market phases.
Bitcoin ETF: Sell The News
In a small burst of euphoria, bitcoin jumped to a two-year high last Thursday as spot bitcoin ETFs began trading in the US, with the price briefly crossing $49k.
However, traders quickly reversed course and decided to sell the news, with the price quickly falling about 15% in the space of 24 hours to below $42k, despite ETF products taking in $819 billion in net flows over their first two days of trading:

As investors tussle with fear and greed, it can be useful to look at on-chain metrics as sentiment indicators and to better gauge where we might be in the near- and long-term cycle, relative to historical cycles.
For the first time, investors can see their fear and greed on-chain.
Market Value to Realized Value (MVRV) Ratio
MVRV is a measure of the current market cap of bitcoin (market value) relative to the aggregate cost basis of all bitcoins (realized value). When this metric falls below one, it means bitcoin holders in aggregate are underwater and has historically indicated major market bottoms. On the other hand, spikes above 4 have historically coincided with market tops.
A year ago as we entered 2023 the MVRV sat at 0.84, indicating oversold conditions.
After the rally of the last year, MVRV crossed over 2 for the first time in the new cycle just over a month ago on 12/5/2023, and currently sits at 1.9:
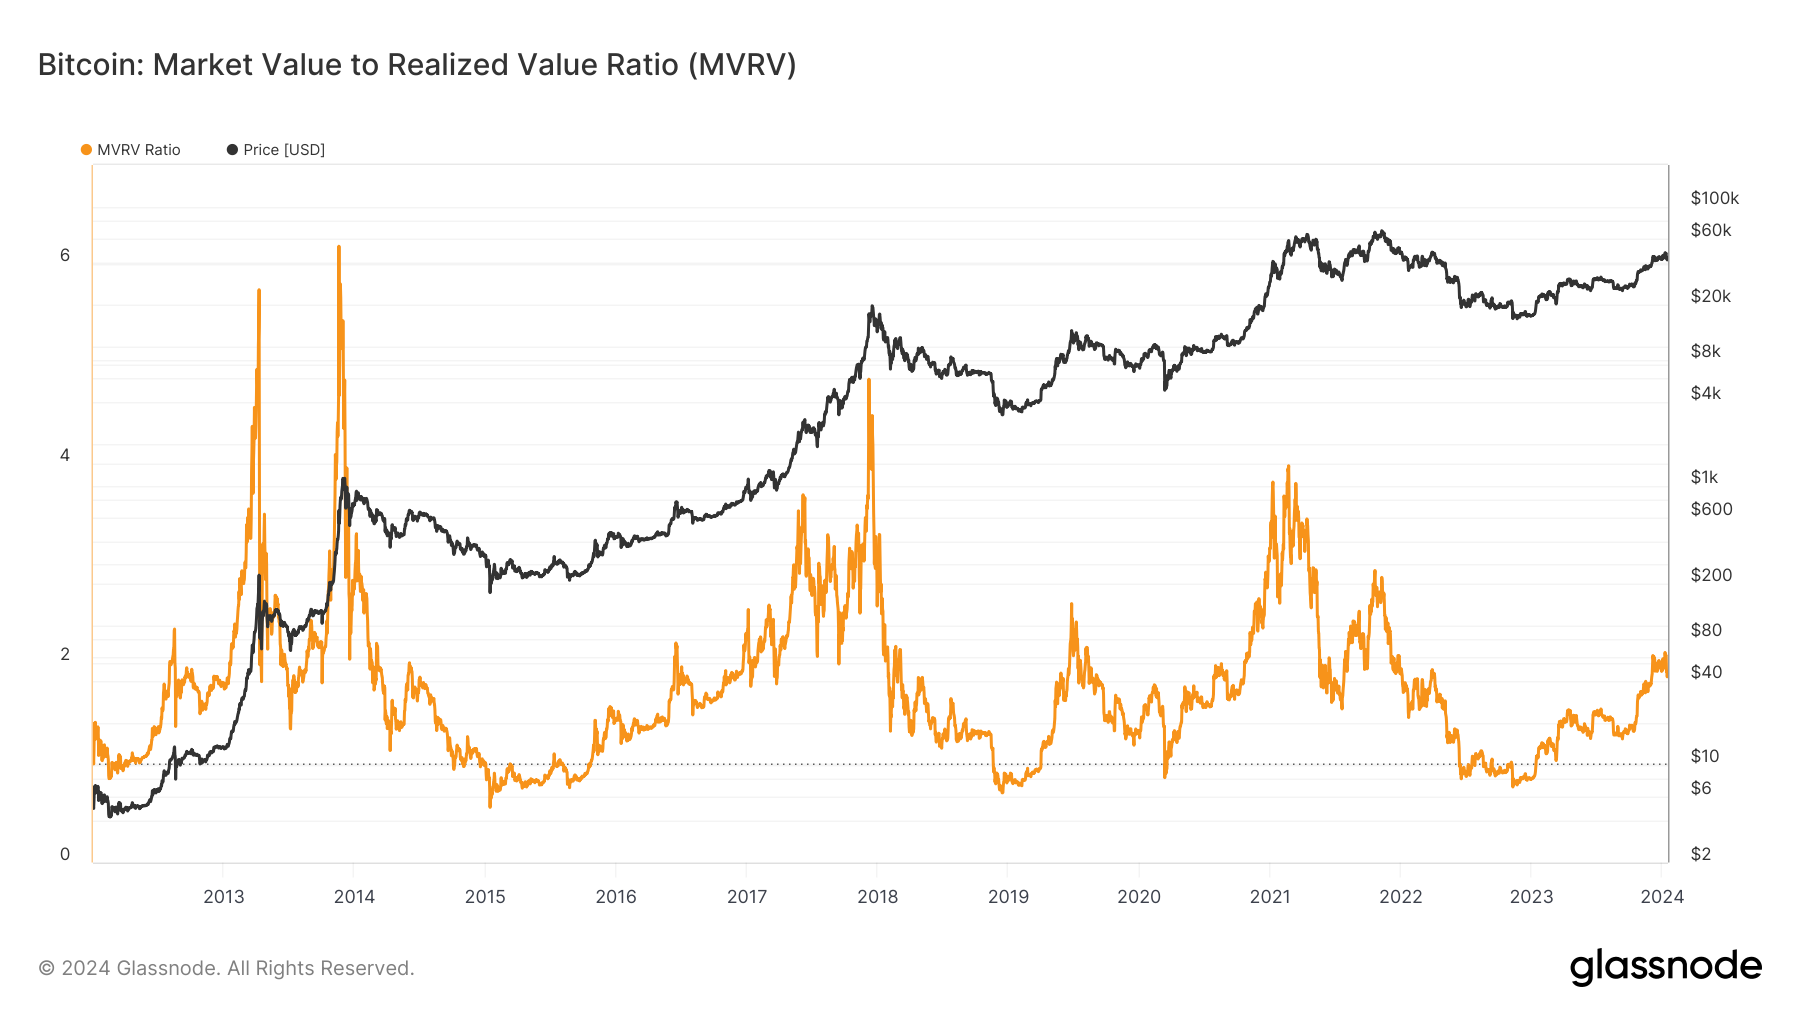
In examining this chart, we can see that the MVRV crossing 2 has historically indicated price may be a bit extended in the short-run, with significant bull market corrections after MVRV crested 2 occuring in 2012, 2016, and 2019.
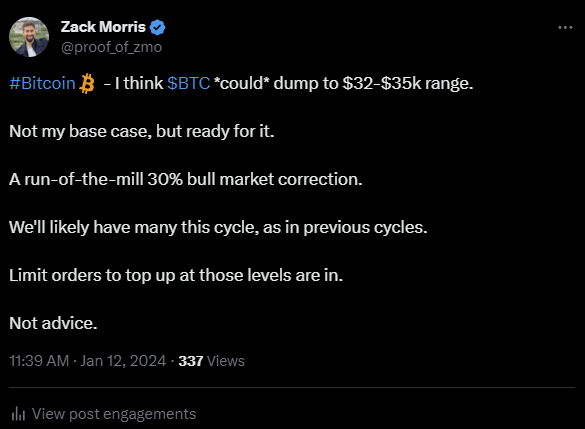
A similar pullback this time around would put us in the $32k - $35k range:
Ultimately, though, previous corrections after the MVRV crossed 2 for the first time in a new cycle were, indeed, just pullbacks, and not the start of a new bear market, as MVRV has crested at least 4 in all previous major market tops, marking a state of market euphoria.
As far as timing in the cycle, the MVRV crossing 2 for the first time coming out of a bear market has historically indicated we are somewhere between 1/3rd and 2/3rds of the way into the new cycle — 39% - 63% to be precise:

So far, the current cycle seems to be mirroring previous cycles quite closely, with MVRV emerging above 2 about half-way through what we would expect the current cycle to be if it matches the duration of previous cycles.
If history holds this cycle would run through Q4 2025.
Long-Term Holder Supply
Another aspect of current on-chain behavior that rhymes with previous cycles is the increase in long-term holder supply throughout the early stages of a new bull market.
Long-term holder supply measures the absolute number of coins that haven’t been moved in the last ~155 days and currently sits near an all-time high at 14.89 million BTC, or 76% of total circulating supply:
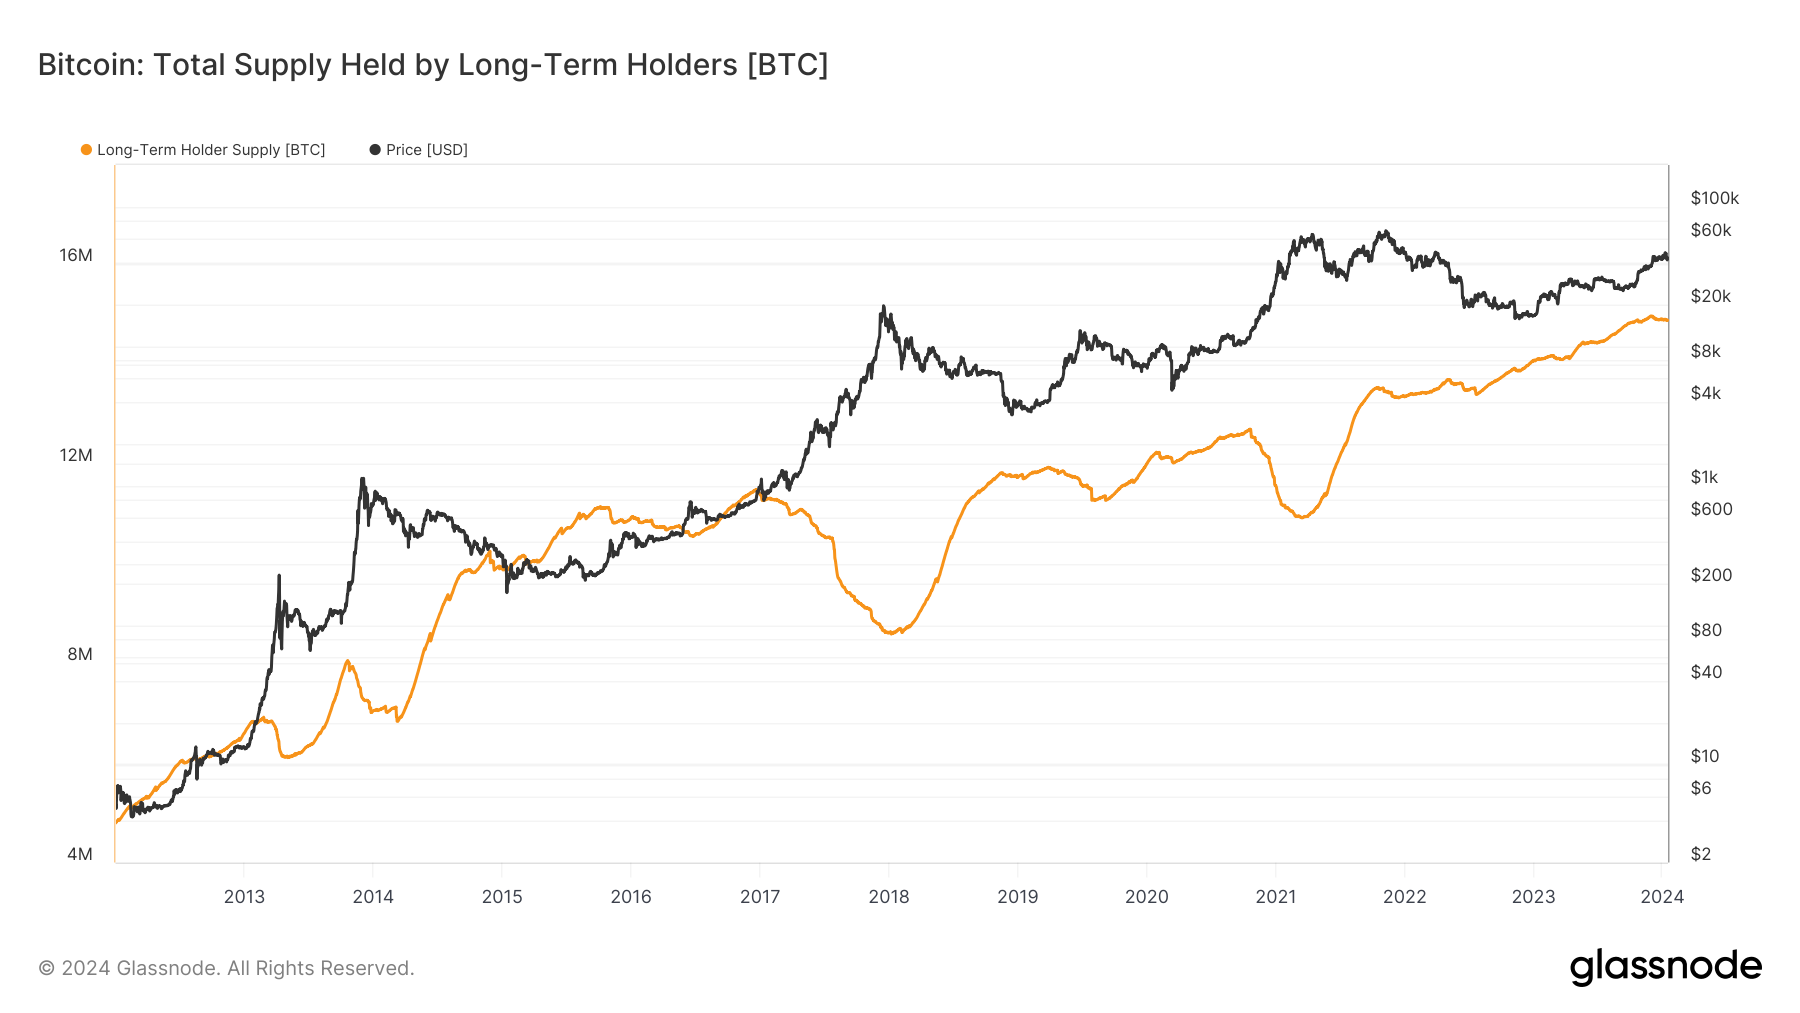
As in previous cycles, long-term holder supply has steadily increased through the bear market and the early stages of the new bull. Long-term holders have historically timed the market pretty well, with the large drawdowns in long-term holder supply in the chart above coinciding with major market tops.
This is somewhat of a self-fulfilling prophecy, as those dips in long-term holder supply represent profit-taking; however, it is still a valuable on-chain indicator as historically price has remained firm unless and until long-term holders begin distributing coins in a more serious manner than they are today.
As it stands today, long-term holder supply has just rolled over slightly from it’s peak about a month ago. This metric bears monitoring as we progress through the cycle as a deeper drawdown in long-term holder supply may indicate we are again near a market top.
Long-term holder net position change measures the change in long-term holder supply over the past 30 days. Drawdowns of >500k BTC have historically indicated we are near cycle peaks.
Today’s reading of just -12k BTC is still relatively benign.

While every market cycle is different and this one will surely be full of surprises, the public, global, open, and immutable nature of bitcoin affords us clues into the psychology of investors and a helpful blueprint for navigating whatever market environment we find ourselves in.